Designing a Production-Grade Kafka + ELK Logging Pipeline on K8s - Part 1
Hello everyone!
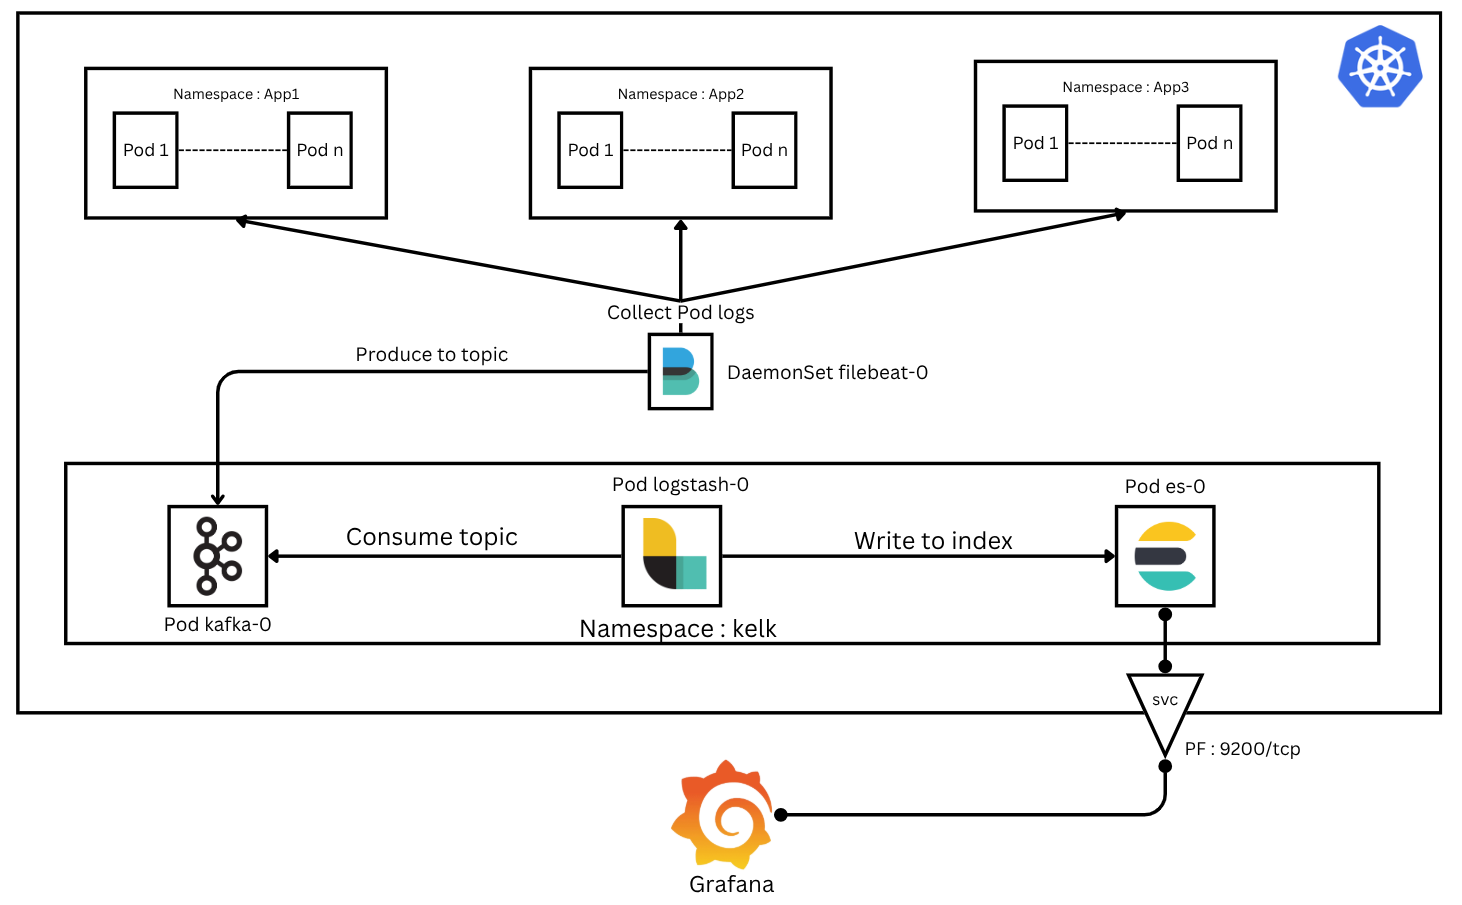
In my first blog post, I explored how I integrated Kafka into the SIEM (ELK Stack) to streamline and scale log ingestion. The setup worked well using Docker Compose, allowing me to quickly spin up the ELK Stack and Kafka brokers to demonstrate a reliable log processing pipeline.
As the project grew, I began to notice a key limitation of Docker Compose — it doesn’t scale efficiently for distributed or production-grade workloads. Managing replicas, ensuring high availability, handling node failures, and dynamically scheduling containers all become challenging as the environment expands.
This led me to take the next logical step: migrating the entire architecture to Kubernetes (K8s), a powerful container orchestration platform that automates deployment, scaling, and management of containerized applications. Our goal is to deploy a robust log ingestion pipeline inside Kubernetes and integrate various log sources — whether they are network logs, application logs, or logs from monolithic or microservice applictions.
In this Part 1 post, I’ll walk you through:
Deploying the different KELK resources on Minikube
Validate & Testing the deployment by ingesting messages into Kafka and visualizing them in Grafana
Let’s get started!
Deployment
you need a running k8s controll node (i used minikube in this blog post)
let’s start by creating a namespace
1
kubectl create namespace kelk
Namespaces in Kubernetes help isolate resources logically. By creating a dedicated kelk namespace, we ensure that kelk resources do not interfere with other applications running in the cluster.
Kafka deployment
In newer versions, Apache Kafka no longer depends on ZooKeeper to manage cluster metadata or handle controller elections. Instead, it introduces a new operating mode called KRaft (Kafka Raft Metadata mode), which allows Kafka to operate independently of ZooKeeper, simplifying the architecture.
- Set Up kafka Persistent Storage
1
2
3
4
5
6
7
8
9
10
11
apiVersion: v1
kind: PersistentVolumeClaim
metadata:
  name: kafka-pvc
  namespace: kelk
spec:
  accessModes:
    - ReadWriteOnce
  resources:
    requests:
      storage: 5Gi
Kafka stores logs and metadata on disk. A PersistentVolumeClaim (PVC) ensures that Kafka data persists even if the Pod is restarted, avoiding data loss.
- Kafka Service
1
2
3
4
5
6
7
8
9
10
11
12
13
14
15
16
17
apiVersion: v1
kind: Service
metadata:
  name: kafka-service
  namespace: kelk
spec:
  selector:
    app: kafka
  ports:
    - name: kafka
      protocol: TCP
      port: 9092
      targetPort: 9092
    - name: controller
      protocol: TCP
      port: 9093
      targetPort: 909
The service is optional for a single-node setup, but it becomes essential in a multi-node cluster for broker-to-broker and client communication.
- Deploy Kafka as a StatefulSet
1
2
3
4
5
6
7
8
9
10
11
12
13
14
15
16
17
18
19
20
21
22
23
24
25
26
27
28
29
30
31
32
33
34
35
36
37
38
39
40
41
42
43
44
45
46
47
48
49
50
51
52
53
54
apiVersion: apps/v1
kind: StatefulSet
metadata:
  name: kafka
  namespace: kelk
spec:
  serviceName: "kafka-service"
  replicas: 1
  selector:
    matchLabels:
      app: kafka
  template:
    metadata:
      labels:
        app: kafka
    spec:
      containers:
        - name: kafka
          image: apache/kafka:latest
          ports:
            - containerPort: 9092
              name: kafka
            - containerPort: 9093
              name: controller
          volumeMounts:
            - name: kafka-storage
              mountPath: /var/lib/kafka/data
          env:
            - name: KAFKA_PROCESS_ROLES
              value: "broker,controller"
            - name: KAFKA_CONTROLLER_LISTENER_NAMES
              value: "CONTROLLER"
            - name: KAFKA_LISTENERS
              value: "PLAINTEXT://:9092,CONTROLLER://:9093"
            - name: KAFKA_CONTROLLER_QUORUM_VOTERS
              value: "1@kafka-0.kafka-service.kelk.svc.cluster.local:9093"
            - name: KAFKA_NODE_ID
              value: "1"
            - name: KAFKA_LISTENER_SECURITY_PROTOCOL_MAP
              value: "PLAINTEXT:PLAINTEXT,CONTROLLER:PLAINTEXT"
            - name: KAFKA_OFFSETS_TOPIC_REPLICATION_FACTOR
              value: "1"
            - name: KAFKA_TRANSACTION_STATE_LOG_REPLICATION_FACTOR
              value: "1"
            - name: KAFKA_ADVERTISED_LISTENERS
              value: "PLAINTEXT://kafka-0.kafka-service.kelk.svc.cluster.local:9092"
            - name: KAFKA_LOG_DIRS
              value: "/var/lib/kafka/data"
            - name: KAFKA_INTER_BROKER_LISTENER_NAME
              value: "PLAINTEXT"
      volumes:
        - name: kafka-storage
          persistentVolumeClaim:
            claimName: kafka-pvc
the yaml config file can be in a single file and apply them with :
1
k apply <file_name>.yaml
Elasicsearch Deployment
Elasticsearch serves as the database where Logstash writes logs ingested from Kafka topics.
- Set Up ES Persistent Storage
1
2
3
4
5
6
7
8
9
10
11
apiVersion: v1
kind: PersistentVolumeClaim
metadata:
  name: es-pvc
  namespace: kelk
spec:
  accessModes:
    - ReadWriteOnce
  resources:
    requests:
      storage: 5Gi
- Set Up ES Service
1
2
3
4
5
6
7
8
9
10
11
12
13
14
15
16
17
apiVersion: v1
kind: Service
metadata:
  name: es-service
  namespace: kelk
spec:
  selector:
    app: es
  ports:
    - name: http
      protocol: TCP
      port: 9200
      targetPort: 9200
    - name: transport
      protocol: TCP
      port: 9300
      targetPort: 9300
This service is necessary for Grafana (kibana) or any other client to access Elasticsearch indexes.
- Deploy Kafka as a StatefulSet
1
2
3
4
5
6
7
8
9
10
11
12
13
14
15
16
17
18
19
20
21
22
23
24
25
26
27
28
29
30
31
32
33
34
35
36
37
38
39
40
41
42
43
44
apiVersion: apps/v1
kind: StatefulSet
metadata:
  name: es
  namespace: kelk
spec:
  serviceName: "es-service"
  replicas: 1
  selector:
    matchLabels:
      app: es
  template:
    metadata:
      labels:
        app: es
    spec:
      containers:
        - name: es
          image: docker.elastic.co/elasticsearch/elasticsearch:8.10.2
          ports:
            - containerPort: 9200
              name: http
            - containerPort: 9300
              name: transport
          volumeMounts:
            - name: es-storage
              mountPath: /usr/share/elasticsearch/data
          env:
            - name: cluster.name
              value: "kafka-cluster"
            - name: bootstrap.memory_lock
              value: "true"
            - name: network.host
              value: "0.0.0.0"
            - name: discovery.type
              value: "single-node"
            - name: xpack.security.enabled
              value: "false"
            - name: ES_JAVA_OPTS
              value: "-Xms512m -Xmx512m"
      volumes:
        - name: es-storage
          persistentVolumeClaim:
            claimName: es-pv
logstash Deployment
logstash is a very powerful tool, it has the capability to pull and collect data from a numbered sources, and apply different operation such as filtering or enrichiment and then forward the logs to many outputs. For our use case we’ll create a pipeline configuration to instruct logstash to read from a specific kafka topic and outputs it to elasticsearch, and for this we’ll use k8s ConfigMaps:
logstash-kafka.conf :
1
2
3
4
5
6
7
8
9
10
11
12
13
14
input {
  kafka {
    bootstrap_servers => "kafka-0.kafka-service.kelk.svc.cluster.local:9092"
    topics => ["logs"]
  }
}

output {
  elasticsearch {
    hosts => ["http://es-0.es-service.kelk.svc.cluster.local:9200"]
    index => "logs"
    workers => 1
  }
}
logstash.yml :
1
2
http.host: "0.0.0.0"
xpack.monitoring.elasticsearch.hosts: [ "http://es-0.es-service.kelk.svc.cluster.local:9200" ]
- Create ConfigMaps
1
2
kubectl create configmap logstash-config --from-file=logstash-kafka.conf -n kelk
kubectl create configmap logstash-yaml --from-file=logstash.yml -n kelk
- Set Up ES Persistent Storage
1
2
3
4
5
6
7
8
9
10
11
apiVersion: v1
kind: PersistentVolumeClaim
metadata:
  name: lgstch-pvc
  namespace: kelk
spec:
  accessModes:
    - ReadWriteOnce
  resources:
    requests:
      storage: 5Gi
- Deploy logstash as a StatefulSet
1
2
3
4
5
6
7
8
9
10
11
12
13
14
15
16
17
18
19
20
21
22
23
24
25
26
27
28
29
30
31
32
apiVersion: apps/v1
kind: StatefulSet
metadata:
  name: logstash-service
  namespace: kelk
spec:
  replicas: 1
  selector:
    matchLabels:
      app: logstash
  template:
    metadata:
      labels:
        app: logstash
    spec:
      containers:
        - name: logstash
          image: docker.elastic.co/logstash/logstash:8.10.2
          volumeMounts:
            - name: logstash-config-volume
              mountPath: /usr/share/logstash/pipeline/logstash.conf
              subPath: logstash-kafka.conf
            - name: logstash-yaml-volume
              mountPath: /usr/share/logstash/config/logstash.yml
              subPath: logstash.yml
      volumes:
        - name: logstash-config-volume
          configMap:
            name: logstash-config
        - name: logstash-yaml-volume
          configMap:
            name: logstash-yam
Deployment Validation
Check all resources:
1
2
3
4
5
6
7
8
9
10
11
12
13
14
$ k get all -n kelk
NAME                     READY   STATUS    RESTARTS      AGE
pod/es-0                 1/1     Running   2 (13h ago)   18h
pod/kafka-0              1/1     Running   2 (13h ago)   20h
pod/logstash-service-0   1/1     Running   1 (13h ago)   16h

NAME                    TYPE        CLUSTER-IP     EXTERNAL-IP   PORT(S)             AGE
service/es-service      ClusterIP   10.107.125.4   <none>        9200/TCP,9300/TCP   18h
service/kafka-service   ClusterIP   10.101.25.94   <none>        9092/TCP,9093/TCP   21h

NAME                                READY   AGE
statefulset.apps/es                 1/1     18h
statefulset.apps/kafka              1/1     20h
statefulset.apps/logstash-service   1/1     16h
Validating ConfigMaps and pvc
1
2
3
4
$ k get pvc -n kelk
NAME        STATUS   VOLUME                                     CAPACITY   ACCESS MODES   STORAGECLASS   VOLUMEATTRIBUTESCLASS   AGE
es-pvc      Bound    pvc-a35c2dba-2236-4128-ad47-9df39596f9a5   5Gi        RWO            standard       <unset>                 18h
kafka-pvc   Bound    pvc-e85e8b6b-59bc-4d68-bf99-62ef7e8e6ee6   5Gi        RWO            standard       <unset>                 20h
1
2
3
4
5
$ k get configmap -n kelk
NAME               DATA   AGE
kube-root-ca.crt   1      21h
logstash-config    1      17h
logstash-yaml      1      16h
Testing the Pipeline
before satrting to ingest and visualize data, let’s port forward the es service, this can be done by a simple command or be permanent by changing the service type to NodePort
Port Forward ES
1
k port-forward pod/es-0 --address 0.0.0.0 9200:9200 -n kelk
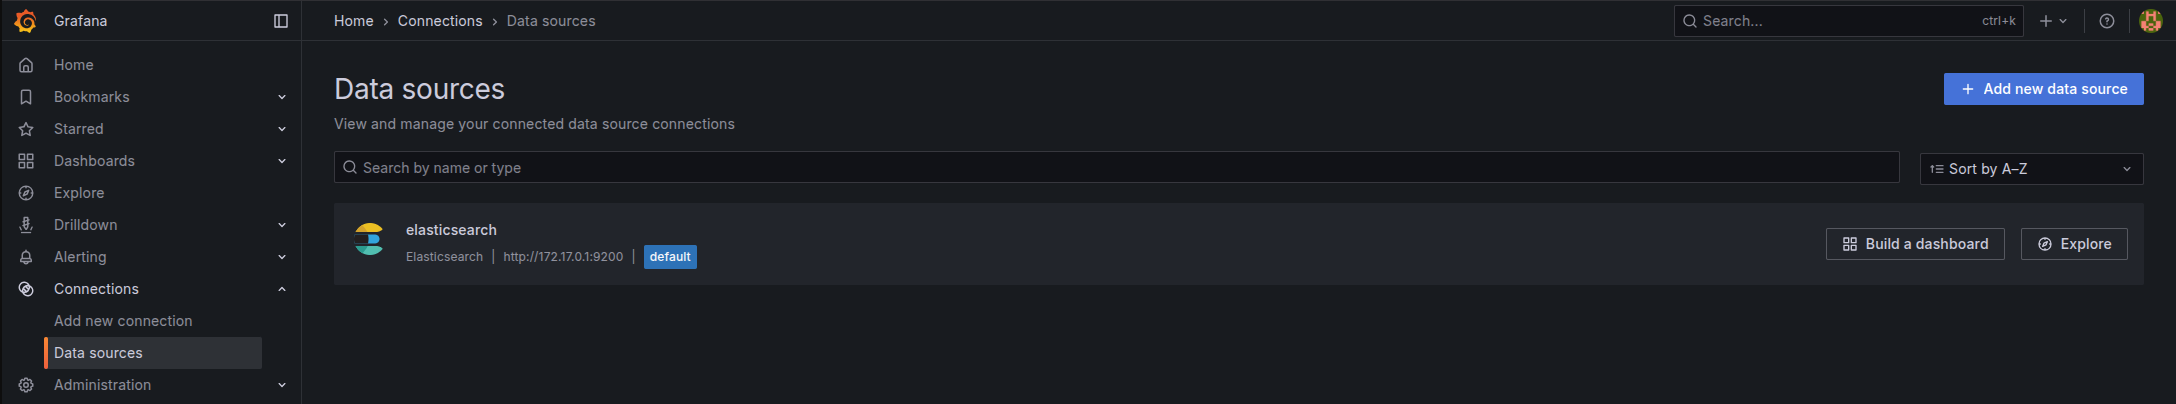
then in grafana make a new data source connection with you host IP address (localhost will work)
Producing kafka messages
first access to the pod :
1
2
3
4
5
k exec -it pod/kafka-0 -n kelk -- /bin/bash
kafka-0:/$ /opt/kafka/bin/kafka-console-producer.sh --topic logs --bootstrap-server localhost:9092
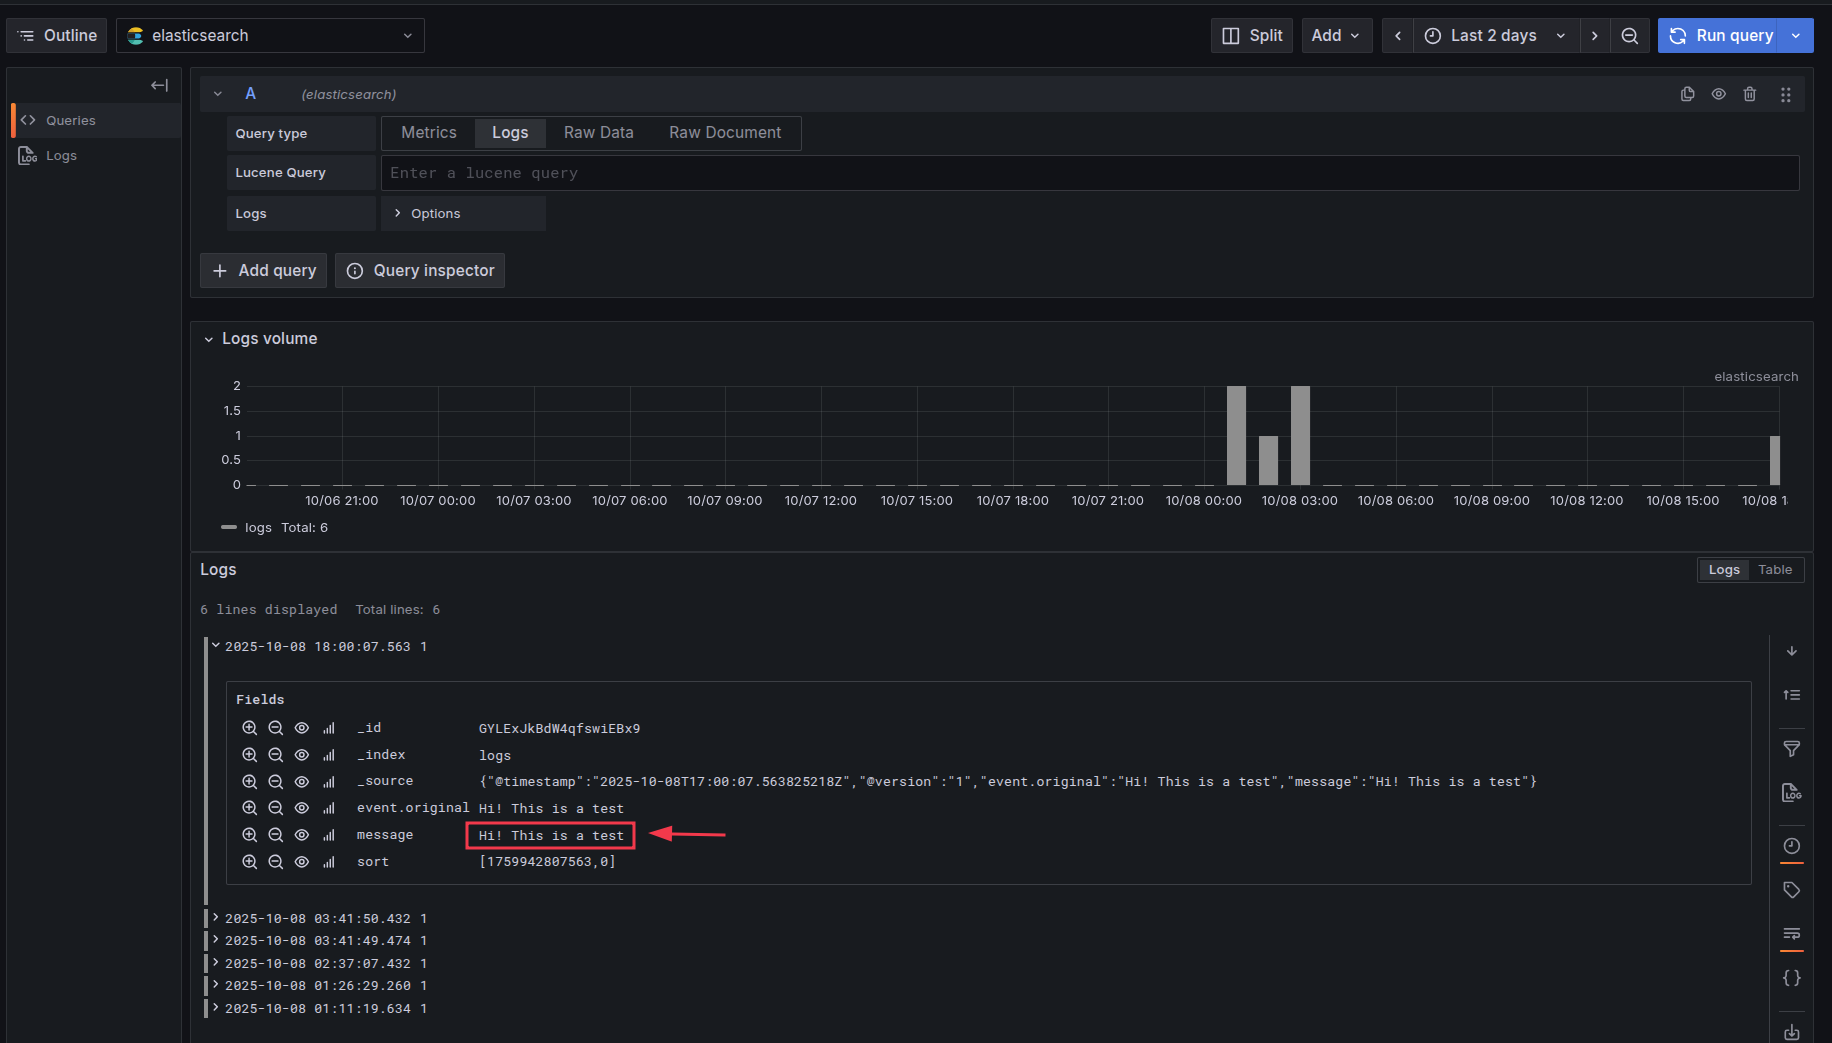
>Hi! This is a test
>
let’s check grafana if the message was ingested right (go to explore and choose logs):
Conclusion
You now have a fully functional KELK log ingestion pipeline on k8s using Kafka, Elasticsearch, and Logstash. This setup can be extended for multiple topics, additional log sources, and scaled across nodes when moving from Minikube to a production cluster.
Stay tuned for Part 2, where we will integrate Filebeat as DaemonSet to collect pod/container logs and filtering or enrich our log data.