KELK Project - Building a Scalable Log Pipeline with Kafka and ELK Stack
Comprehensive guide to building a KELK (Kafka + ELK) log pipeline for cybersecurity monitoring. Learn Docker setup, Filebeat configuration, and real-time log processing for threat detection.
Hello, and welcome! With our growing systems and an increasing number of endpoints, managing logs has become a crucial step in both securing our infrastructure and ensuring its reliability. Logs serve as the pulse of our systems, offering valuable insights that empower us to detect anomalies, troubleshoot issues, and maintain operational excellence.
Creating an appropriate log pipeline is not just a best practice but a fundamental aspect of modern cybersecurity engineering. In this blog, we’ll explore how to set up a robust log collection and management pipeline that supports your security and reliability goals.
Introduction
Kafka is a distributed event-streaming platform designed to handle high-throughput, real-time data feeds. It is widely used for building data pipelines and streaming applications. Kafka excels in log collection systems by providing a durable, fault-tolerant, and scalable platform to manage data flow from various sources to endpoints like log storage, analysis tools, and SIEM systems.
Here’s why Kafka is a perfect fit for our log pipeline:
- Scalability: Kafka can handle massive amounts of log data from distributed systems without performance degradation.
- Reliability: With its fault-tolerant architecture, Kafka ensures that logs are stored and transmitted even in case of failures.
- Real-time Processing: Logs can be streamed and processed in near real-time, enabling quicker insights and faster incident response.
- Integration: Kafka integrates seamlessly with various tools and frameworks, including Elasticsearch, Logstash, and SIEM solutions, making it a cornerstone of modern observability stacks.
Objectif
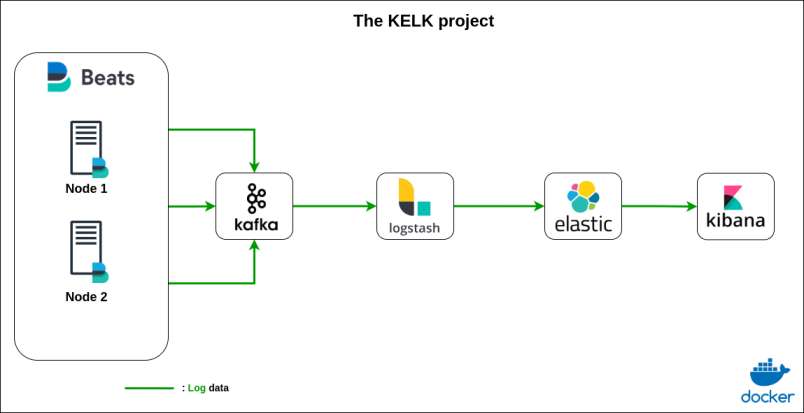
by the end of this tutorial we’ll be able to create a log pipeline just as follows :
Kafka and Zookeper Services
Kafka relies on Zookeeper to coordinate the components of its distributed system. Although newer versions of Kafka are transitioning away from this dependency, Zookeeper remains essential in many deployments for its reliability and simplicity in managing distributed systems.
Setting Up Kafka and Zookeeper
you can use this docker-compose file to set up an easy to go kafka and zookeeper services :
1
2
3
4
5
6
7
8
9
10
11
12
13
14
15
16
17
18
19
20
21
22
23
24
25
26
27
28
29
30
31
version: "3.3"
services:
#zookeeper service
  zookeeper:
    image: confluentinc/cp-zookeeper:7.2.0
    container_name: zookeeper-cntr
    environment:
      ZOOKEEPER_CLIENT_PORT: 2181
      ZOOKEEPER_TICK_TIME: 2000
    networks:
      - kafka_elk_nw
#kafka service
  kafka:
    image: confluentinc/cp-kafka:7.2.0
    restart: unless-stopped
    container_name: kafka-cntr
    ports:
      - 29092:29092
    depends_on:
      - zookeeper
    environment:
      KAFKA_BROKER_ID: 1
      KAFKA_ZOOKEEPER_CONNECT: zookeeper-cntr:2181
      KAFKA_ADVERTISED_LISTENERS: PLAINTEXT://kafka-cntr:9092,PLAINTEXT_HOST://localhost:29092
      KAFKA_LISTENER_SECURITY_PROTOCOL_MAP: PLAINTEXT:PLAINTEXT,PLAINTEXT_HOST:PLAINTEXT
      KAFKA_INTER_BROKER_LISTENER_NAME: PLAINTEXT
      KAFKA_OFFSETS_TOPIC_REPLICATION_FACTOR: 1
      KAFKA_TRANSACTION_STATE_LOG_REPLICATION_FACTOR: 1
      KAFKA_ADVERTISED_HOST_NAME: localhost
    networks:
      - kafka_elk_nw
we’ll define the needed docker networks and volumes later.
Filebeat Service
What is Filebeat?
Filebeat is a lightweight, open-source log shipper designed to collect and forward log data from various sources to centralized systems like Kafka, Elasticsearch, or Logstash. It is ideal for environments where logs are generated in large volumes across multiple endpoints.
Setting Up Filebeat
To integrate Filebeat into our Kafka-based log pipeline, you can use the following configuration:
Docekr-compose File :
1
2
3
4
5
6
7
8
9
10
#filebeat service
  filebeat:
    image: docker.elastic.co/beats/filebeat:8.3.3
    container_name: filebeat
    user: root
    networks:
      - kafka_elk_nw
    volumes:
      - ./filebeat.yml:/usr/share/filebeat/filebeat.yml
      - ./logs:/var/log/apache2
As we can see in the defined volumes, we have configured two local volumes: the first is a YAML configuration file for Filebeat, and the second is a sample Apache-generated log file that will act as our source node.
Filebeat Configuration File :
1
2
3
4
5
6
7
8
9
10
11
12
13
14
15
16
17
18
19
20
21
filebeat.inputs:
- type: filestream
  id: access-logs
  paths:
    - "/var/log/apache2/*.log"

output.kafka:
  hosts: ["kafka-cntr:9092"] # host + port
  topic: "logs" # Default topic
  topics:
    - topic: "error"
      when.contains:
        message: "ERR"
    - topic: "access"
      when.contains:
        message: "\"GET .*\" 200"
  partition.round_robin:
    reachable_only: false
  required_acks: 1
  compression: gzip
  max_message_bytes: 1000000
a sample of apache log files :
1
2
3
212.86.98.19 - - [20/Jan/2025:00:18:31 +0100] "POST /explore HTTP/1.0" 200 5048 "https://www.olson-morris.com/posts/category/postssearch.php" "Mozilla/5.0 (Macintosh; U; PPC Mac OS X 10_8_5; rv:1.9.4.20) Gecko/2885-02-13 17:21:22.213737 Firefox/3.6.9"
158.93.254.185 - - [20/Jan/2025:00:20:04 +0100] "GET /list HTTP/1.0" 200 4979 "https://www.carlson.com/categorieshomepage.htm" "Mozilla/5.0 (Windows NT 4.0) AppleWebKit/533.1 (KHTML, like Gecko) Chrome/60.0.813.0 Safari/533.1"
.......
You can use this github repo for generating fake apache logs : repo
Logstash Service
What is Logstash?
Logstash is a data processing pipeline that collects, transforms, and sends data to a destination like Elasticsearch. It serves as the “glue” between your log sources (like Kafka) and Elasticsearch, allowing you to parse, enrich, and format data as needed.
Setting Up Logstash
Here’s a Docker-Compose configuration for Logstash:
1
2
3
4
5
6
7
8
9
10
11
12
13
14
15
16
17
18
19
20
21
22
23
  logstash:
    container_name: logstash-cntr
    image: logstash:7.9.1
    ulimits:
      memlock:
        soft: -1
        hard: -1
    volumes:
      - ./logstash-kafka.conf:/usr/share/logstash/pipeline/logstash-kafka.conf
    ports:
      - 5044:5044
    depends_on:
      - elasticsearch
    stdin_open: true
    tty: true
    restart: always
    networks:
      - kafka_elk_nw
    logging:
      driver: "json-file"
      options:
        max-size: "10m"
        max-file: "50"
A configuration file is also required to connect Kafka and Logstash. Since Logstash acts as a consumer, it needs to know which Kafka topic to pull data from.
logstash-kafka configuration file :
1
2
3
4
5
6
7
8
9
10
11
12
13
14
input {
    kafka {
            bootstrap_servers => "kafka-cntr:9092"
            topics => ["logs"]
    }
}

output {
   elasticsearch {
      hosts => ["elasticsearch-cntr:9200"]
      index => "logs"
      workers => 1
    }
}
Elasticsearch Service
What is Elasticsearch?
Elasticsearch is a powerful, distributed search and analytics engine designed for fast, real-time data processing. It’s the core component of the ELK Stack, responsible for storing and indexing log data for efficient querying and visualization.
Setting Up Elasticsearch?
Here’s how you can add Elasticsearch to your pipeline using Docker-Compose:
1
2
3
4
5
6
7
8
9
10
11
12
13
14
15
16
17
18
19
20
21
22
23
24
25
26
27
28
29
30
31
#elasticsearch service
  elasticsearch:
    container_name: elasticsearch-cntr
    image: elasticsearch:7.9.1
    environment:
      - cluster.name=kafka-cluster
      - bootstrap.memory_lock=true
      - discovery.type=single-node
      - "ES_JAVA_OPTS=-Xms512m -Xmx512m"
      - xpack.security.enabled=false
    volumes:
      - elasticsearch_data:/usr/share/elasticsearch/data:rw
    ulimits:
      memlock:
        soft: -1
        hard: -1
    ports:
      - 9200:9200
      - 9300:9300
    depends_on:
      - kafka
    stdin_open: true
    tty: true
    restart: always
    networks:
      - kafka_elk_nw
    logging:
      driver: "json-file"
      options:
        max-size: "10m"
        max-file: "50"
Kibana Service
What is Kibana ?
Kibana is the visualization layer of the ELK Stack. It allows you to create dashboards, perform searches, and analyze data stored in Elasticsearch.
Setting Up Kibana
Here’s the Docker Compose configuration for Kibana:
1
2
3
4
5
6
7
8
9
10
11
12
13
14
15
16
17
18
19
20
21
22
  kibana:
    container_name: kibana-cntr
    image: kibana:7.9.1
    ulimits:
      memlock:
        soft: -1
        hard: -1
    ports:
      - 5601:5601
    depends_on:
      - elasticsearch
    stdin_open: true
    tty: true
    restart: always
    networks:
      - kafka_elk_nw
    links: ['elasticsearch']
    logging:
      driver: "json-file"
      options:
        max-size: "10m"
        max-file: "50"
=> Now we are going to define the nedded volumes and Networks :
1
2
3
4
5
6
volumes:
  elasticsearch_data:
    driver: local
networks:
  kafka_elk_nw:
    driver: bridge
You can find all the associated code combined in my github repo.
Implemetation
First let’s compose up all the docker containers (i will be using the latest Ubuntu version for testing) : 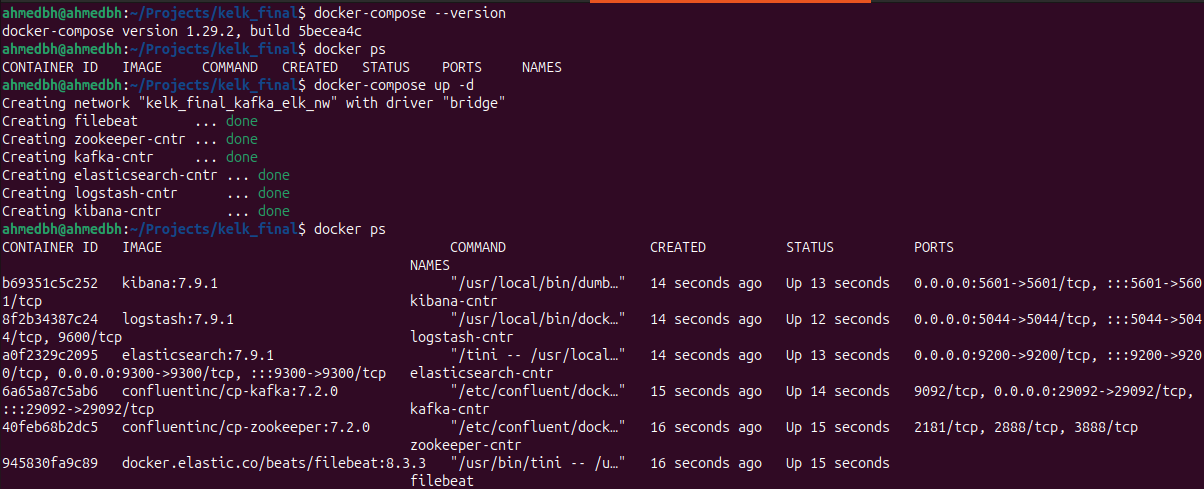 after creating the docker containers lets test the kafka streaming (topic: logs) to check if the logs are being shipped correctly
for this we can use this command to list all kafka topics :
1
docker exec -it kafka-cntr bash /bin/kafka-topics --list --bootstrap-server localhost:909
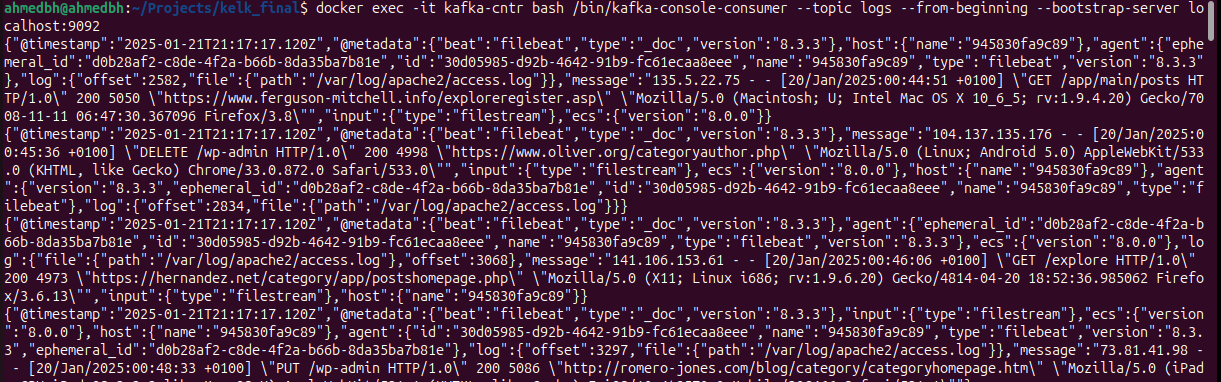
 we can see that the topic logs was created, now let’s see if the logs will be transported right to the consumers, we can achieve this by executing this command :
1
docker exec -it kafka-cntr bash /bin/kafka-console-consumer --topic logs --from-beginning --bootstrap-server localhost:9092
 so far we have confirmed that the logs were collected by filebeat and shipped to Kafka now its time for logstash to ship them to Elasticsearch, for this we’ll use Postman for testing Elasticsearch APIs.
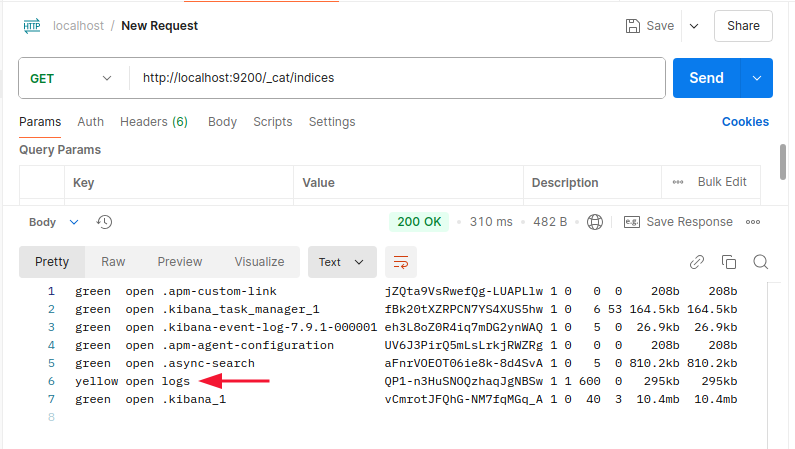
For starters let’s check if the logs Index was created.Elasticsearch indices can be found here :
1
http://localhost:9200/_cat/indices
 Seems fine now lets check the content using :
1
http://localhost:9200/logs/_search
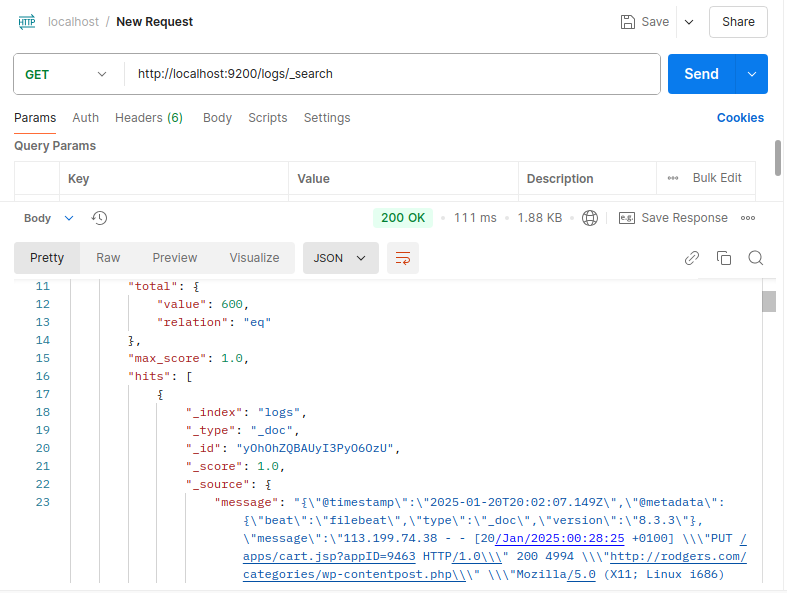 Alright the Elasticsearch is working fine
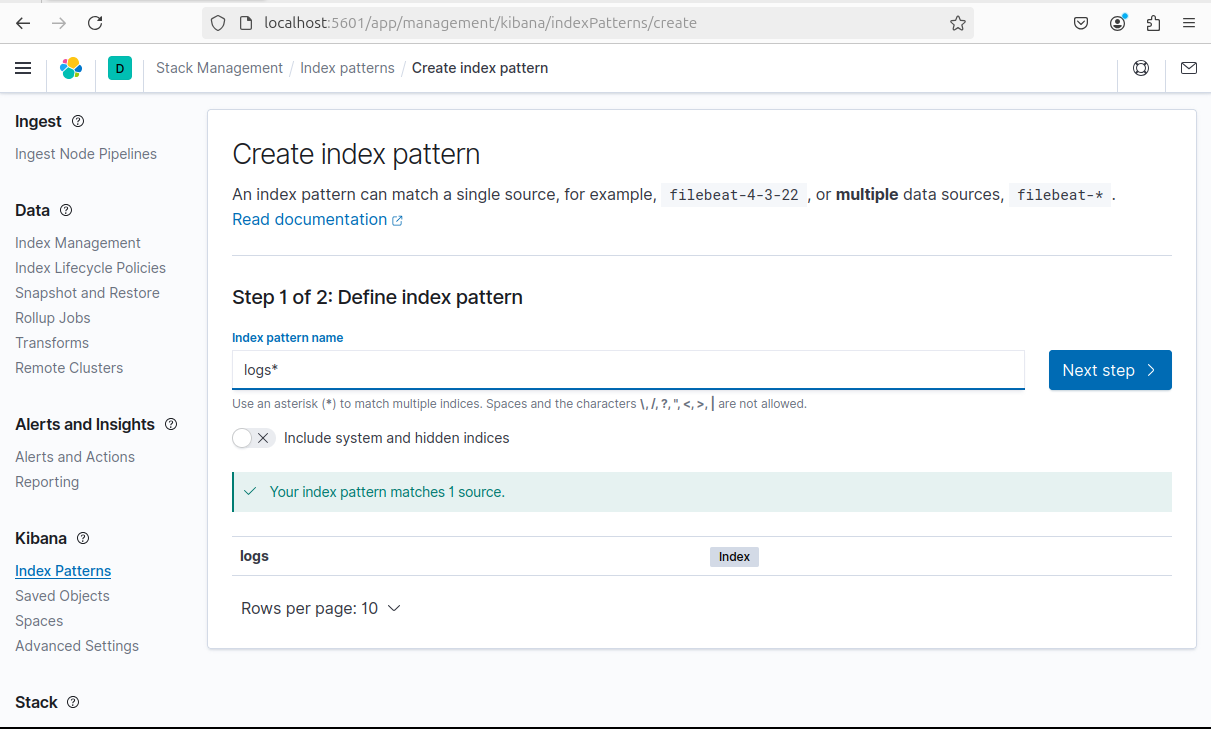
Now it’s time to visualize the logs using Kibana dashboard:
> First We need to create an Index Pattern inside Stack Management in the Kibana section : (kibana can be accessed inside localhost:5601)
 after that return to Kibana > discover
 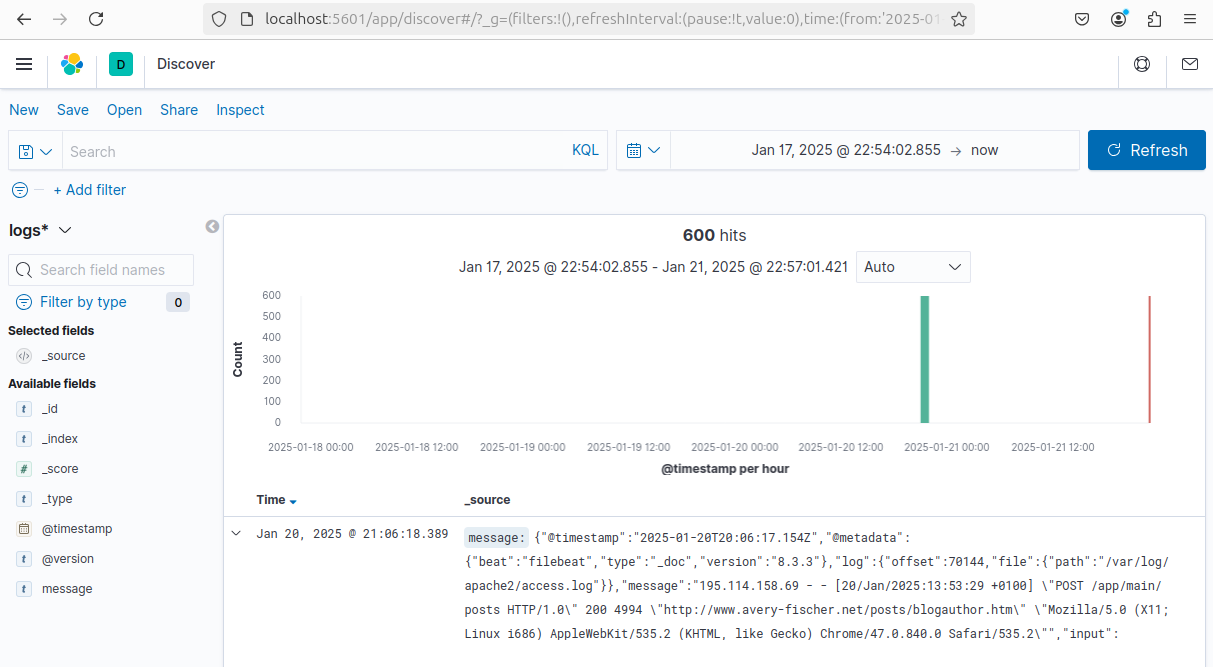 Et voilà! The logs are transported by Filebeat to the Kafka streaming platform. Logstash then collects them, processes them, and ships them to Elasticsearch, where they are finally displayed on the Kibana dashboard.
Thank you for reading! If you have any questions regarding this topic, feel free to email me.