SIEM on Steroids! Elasticsearch MCP Server
A practical guide to using Elasticsearch MCP Server to enhance SOC workflows. Learn how to query alerts, automate detection engineering tasks, and leverage LLMs for investigation at scale.
Hi! A medium to large organization typically receives thousands of alerts and hundreds of thousands of raw events every single day. Now, imagine being a SOC analyst who has to dig through all this noise, hunting for the few real incidents that matter.
Of course, using a SIEM helps — it correlates, filters, and prioritizes events. But even then, the workload is enormous (and honestly, not very healthy in the long run). Analysts still need to pivot, query, and interpret data manually.
Wouldn’t it be perfect if you could just ask ChatGPT to do the heavy lifting for you?
Well… Thats Why MCP Exists!
So what’s MCP anyway and why use it?
MCP stands for Model Context Protocol, It’s a translator between your SOC tools (like Elasticsearch, Wazuh, Suricata or any API-facing service) and an LLM, it’like a GUI but for machines.
It turns boring APIs and queries into natural conversations.
Instead of writing a long Elasticsearch query, you just say: “Hey, show me failed SSH logins in the last 24h” — and boom, the LLM talks to Elasticsearch through MCP and gives you the answer.
Behind the scenes: the LLM actually crafts a request and sends it to the MCP server via stdio or HTTP/S. The MCP server then rolls up its sleeves, does the real work (like querying Elasticsearch), and brings back the results neatly plated for you.
In short: MCP makes your SIEM speak human.
And the best part? You don’t need to be a data wizard — you just ask, and your MCP-powered LLM becomes your tireless SOC sidekick.
MCP Use Cases For SOC Analysts.
Traditional SIEM workflows require analysts to manually craft queries, pivot between dashboards, and correlate artifacts. This works — but it’s slow and cognitively demanding.
With MCP, your LLM can directly:
- Pull alerts from Elasticsearch
- Summarize findings in plain English
- Suggest follow-up queries
- Even enrich indicators using external TI (threat intelligence) APIs
Setting Up Elasticsearch MCP Server
L’ets get our hands dirty deploying and configuering the server.
Assuming you already have access to a running Elasticsearch instance (or cluster) with your SOC logs ingested.
Following the docs on the MCP server GitHub here, we’ll use the Docker image instead of compiling the source code. Just pull the docker image vscode will handle starting conatiners whenever the LLM needs a tool (kinda like Docker MCP Gateway)
1
docker pull docker.elastic.co/mcp/elasticsearch
Remember: this MCP Server is experimental. Do not use it in production yet.
Configure the client
For this example, I’ll use VS Code Copilot, but feel free to use whichever LLM client you prefer.
1
2
3
mkdir mcp_es && cd mcp_es
mkdir .vscode
nano .vscode/mcp.json
Paste this JSON config:
1
2
3
4
5
6
7
8
9
10
11
12
13
14
15
{
  "servers": {
    "elasticsearch-mcp": {
      "type": "stdio",
      "command": "docker",
      "args": [
        "run", "-i", "--rm",
        "-e", "ES_URL=http://$IP:9200",
        "-e", "ES_API_KEY=$ES_APIKEY",
        "docker.elastic.co/mcp/elasticsearch",
        "stdio"
      ]
    }
  }
}
Make sure to replace $IP and $ES_APIKEY with your Elasticsearch host and API key. After this start the server:
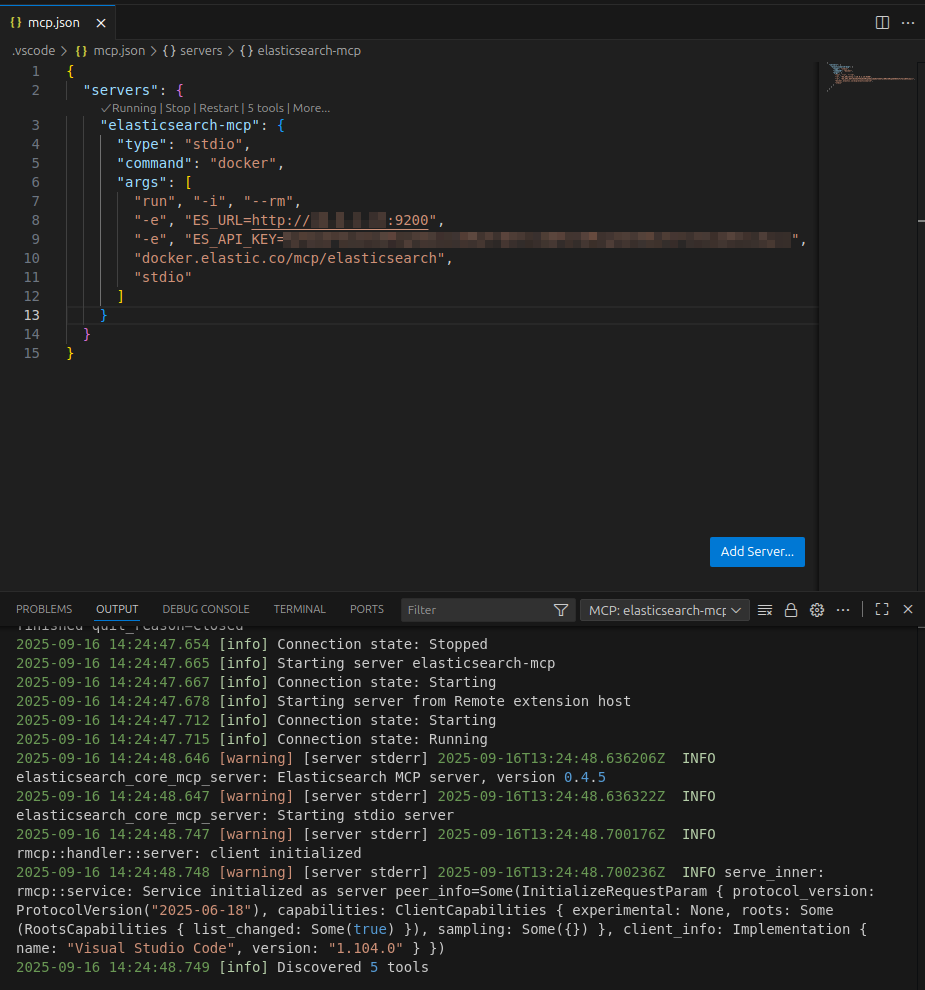
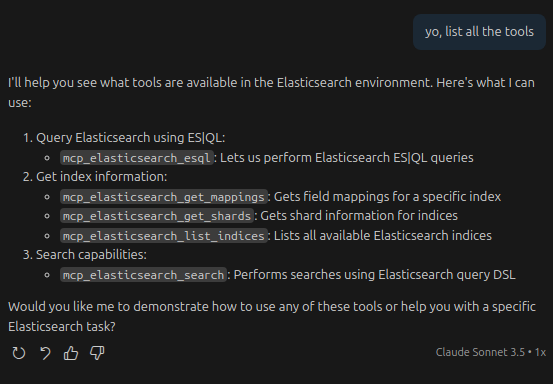
You will notice that the MCP has 5 tools. Let’s ask the agent to list them:
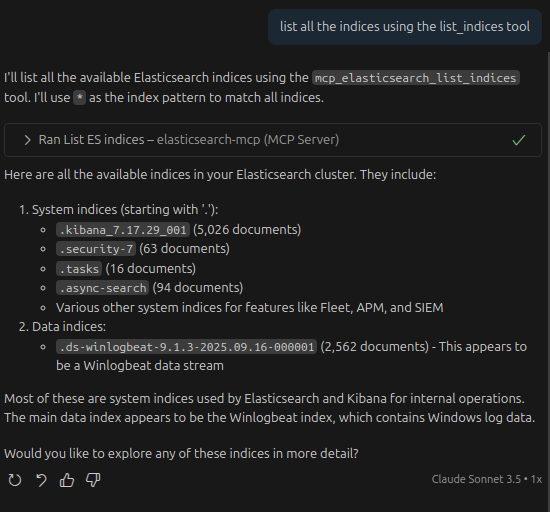
The MCP server provides several tools that include listing indices and performing ES queries. Let’s test listing available indices:
Once we have MCP server integration set up, let’s move on to some SIEM use cases.
SIEM Use Case : Brute force Detection
A simple — yet dangerous — attack vector adversaries use is brute-forcing user credentials. Detecting it quickly reduces risk and makes you look like a hero.
Detection: Multiple Failed Authentications For One User (5-minute window)
Goal: Find multiple authentication failures for the same SubjectUsername originating from the same or many different source.ip addresses in the last 5 minutes.
the detection rule :
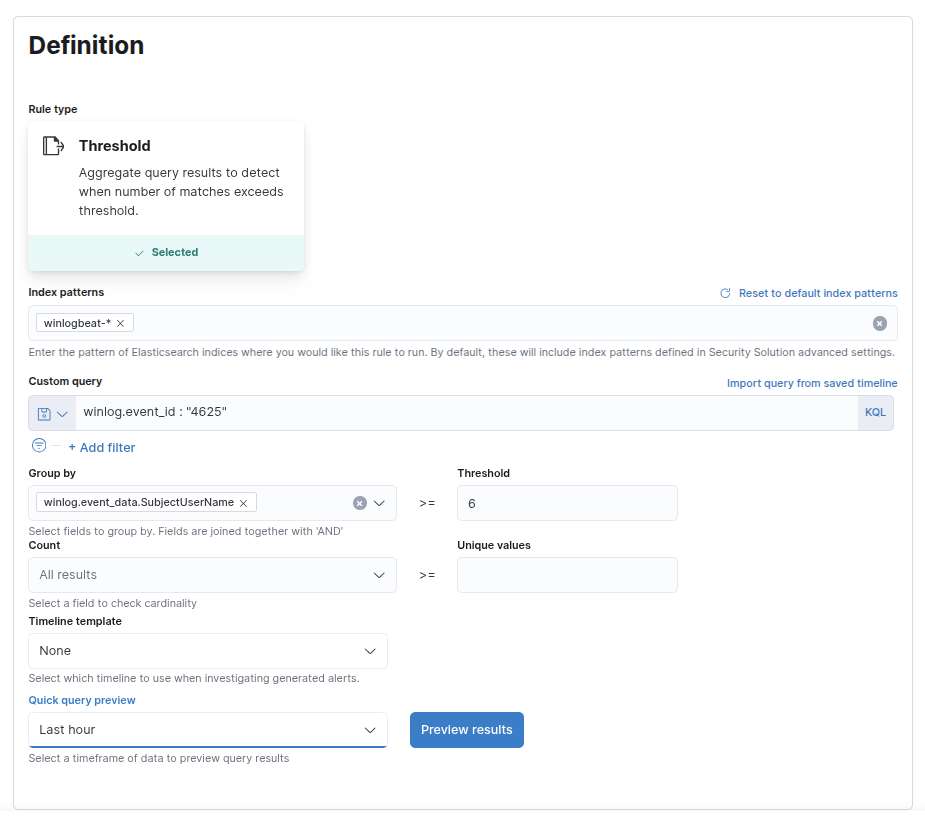
Then configure the schedule to run frequently (e.g., every 1 — 5 minutes) so you catch fast brute-force attempts quickly:

Attack Simulation
for now i only have one alert from previous experiment, now lets try to fail 7+ login attempts from our command prompt :
runas /u:ahmedbh cmd.exe
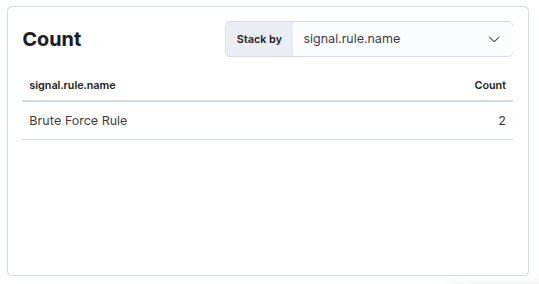
as seen another rule was fired :
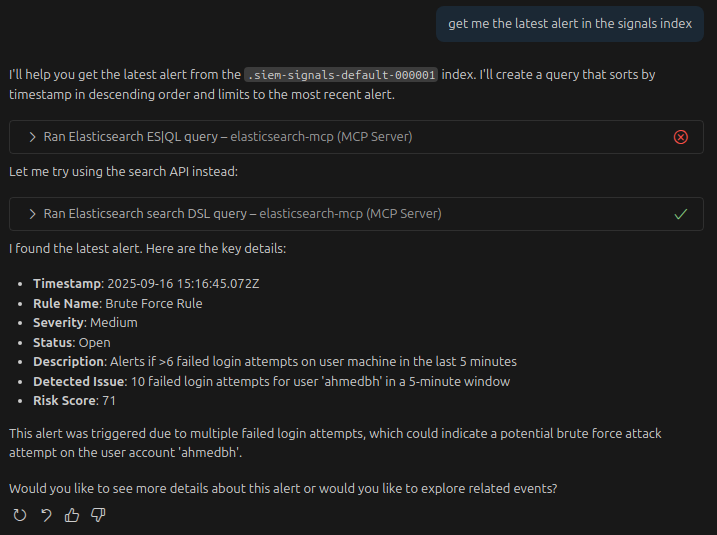
Alert Invistigation using MCP Server
Instead of scrolling through tens (or hundreds) of raw events, let’s use the MCP magic to investigate the alert quickly and confidently.
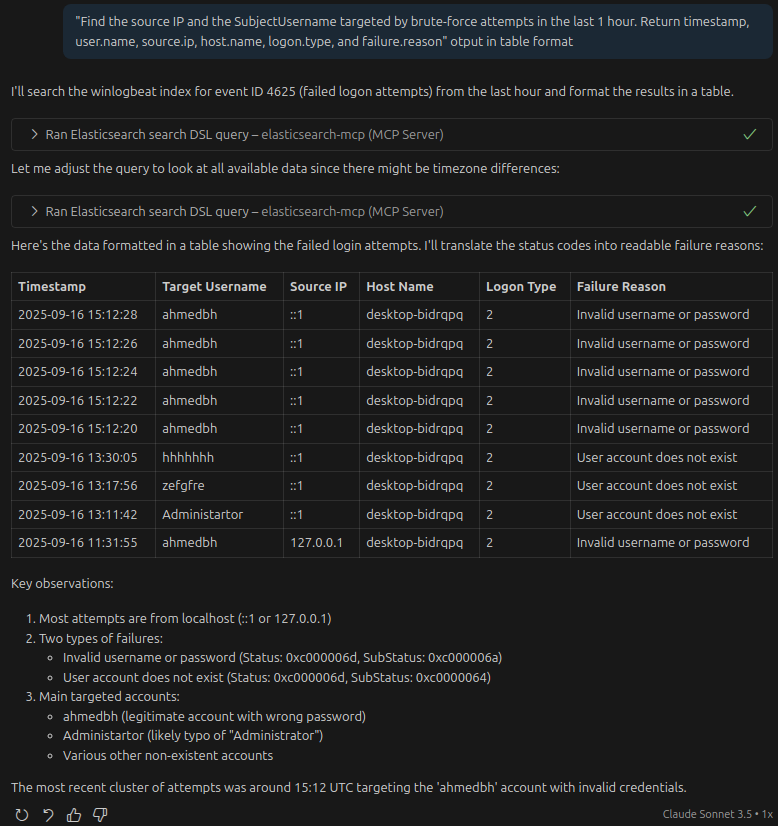
lets get in deep, we’ll try finding out the source ip and the compromised user account user to brute force :
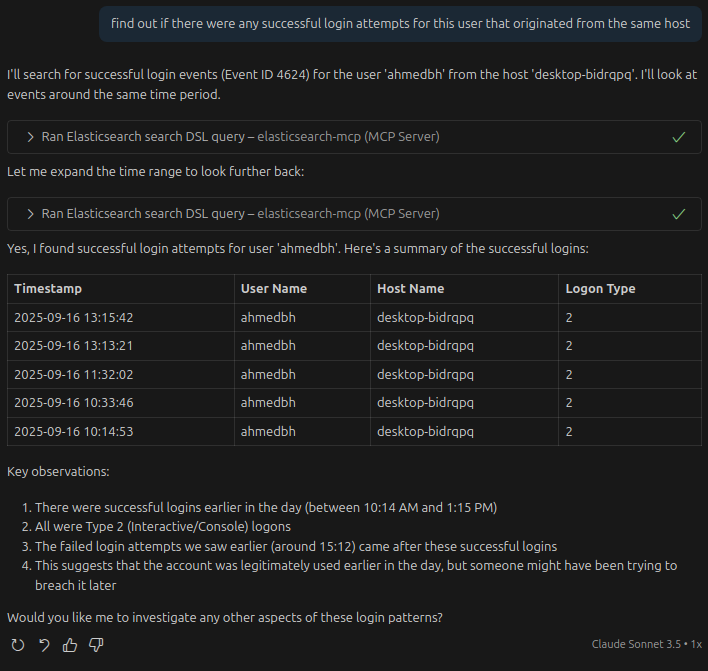
Next step — pivot to check if any of those failed attempts were followed by a successful login for the same user (fast indicator of compromise):
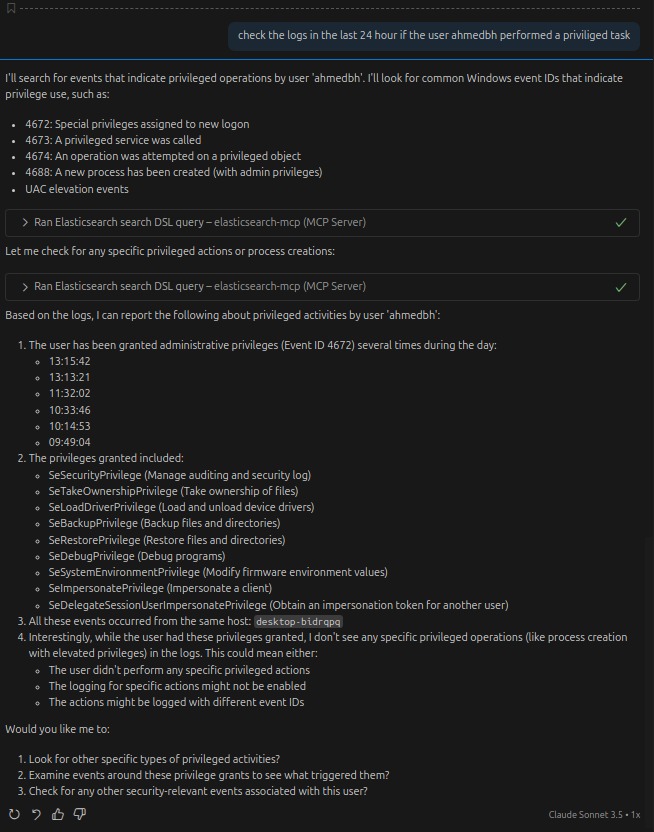
Now we broaden the investigation to look for suspicious activity around that user in the past day:
Process executions (PowerShell, cmd, rundll32)
New services or scheduled tasks (persistence)
Lateral logons to other hosts
Privilege changes (group additions, Admin privileges)
Conclusion
Using MCP to investigate alerts transforms a tedious manual task into a fast, repeatable, and auditable workflow. With a few natural-language prompts your LLM can:
Translate intent into safe Elasticsearch queries,
Aggregate and summarize noisy events,
Enrich indicators with GeoIP and TI, and
Recommend or trigger containment steps (semi-automated).
The result: faster triage, better context, and less analyst fatigue — all while keeping you in control of the response. Drop this workflow into your SOC demo and you’ll show both technical depth and operational maturity.